How to Monitor Analytics Costs in BigQuery Efficiently: A Comprehensive Guide
Mar 14, 2024
Master the art of monitoring and optimizing analytics costs in BigQuery with our detailed guide.
Learn how to use INFORMATION_SCHEMA, craft effective queries, and leverage Looker Studio for comprehensive cost analysis. In the realm of data analytics, where the volume of data processed can escalate rapidly, keeping a vigilant eye on the costs becomes not just beneficial but essential.
This is particularly true for users of Google BigQuery, a powerhouse for analytics that, while powerful, can also accrue significant costs if not carefully managed.
In this guide, we'll explore how to effectively monitor and manage these costs, ensuring that your analytics operations are both powerful and cost-efficient.
BigQuery's Cost Structure Explained
BigQuery operates on a pay-as-you-go pricing model, where the costs are primarily determined by the amount of data processed by your queries.
Understanding this cost structure is the first step in managing your analytics expenses effectively.

Unlocking the Potential of INFORMATION_SCHEMA
The INFORMATION_SCHEMA in BigQuery is a goldmine for anyone looking to monitor their analytics costs.
This special schema contains tables with metadata about your projects, including the JOBS table, which is pivotal for cost analysis.
Query:
This query retrieves all jobs and calculates estimated prices based on the bytes billed and the on-demand rate at $6.15 for TB.
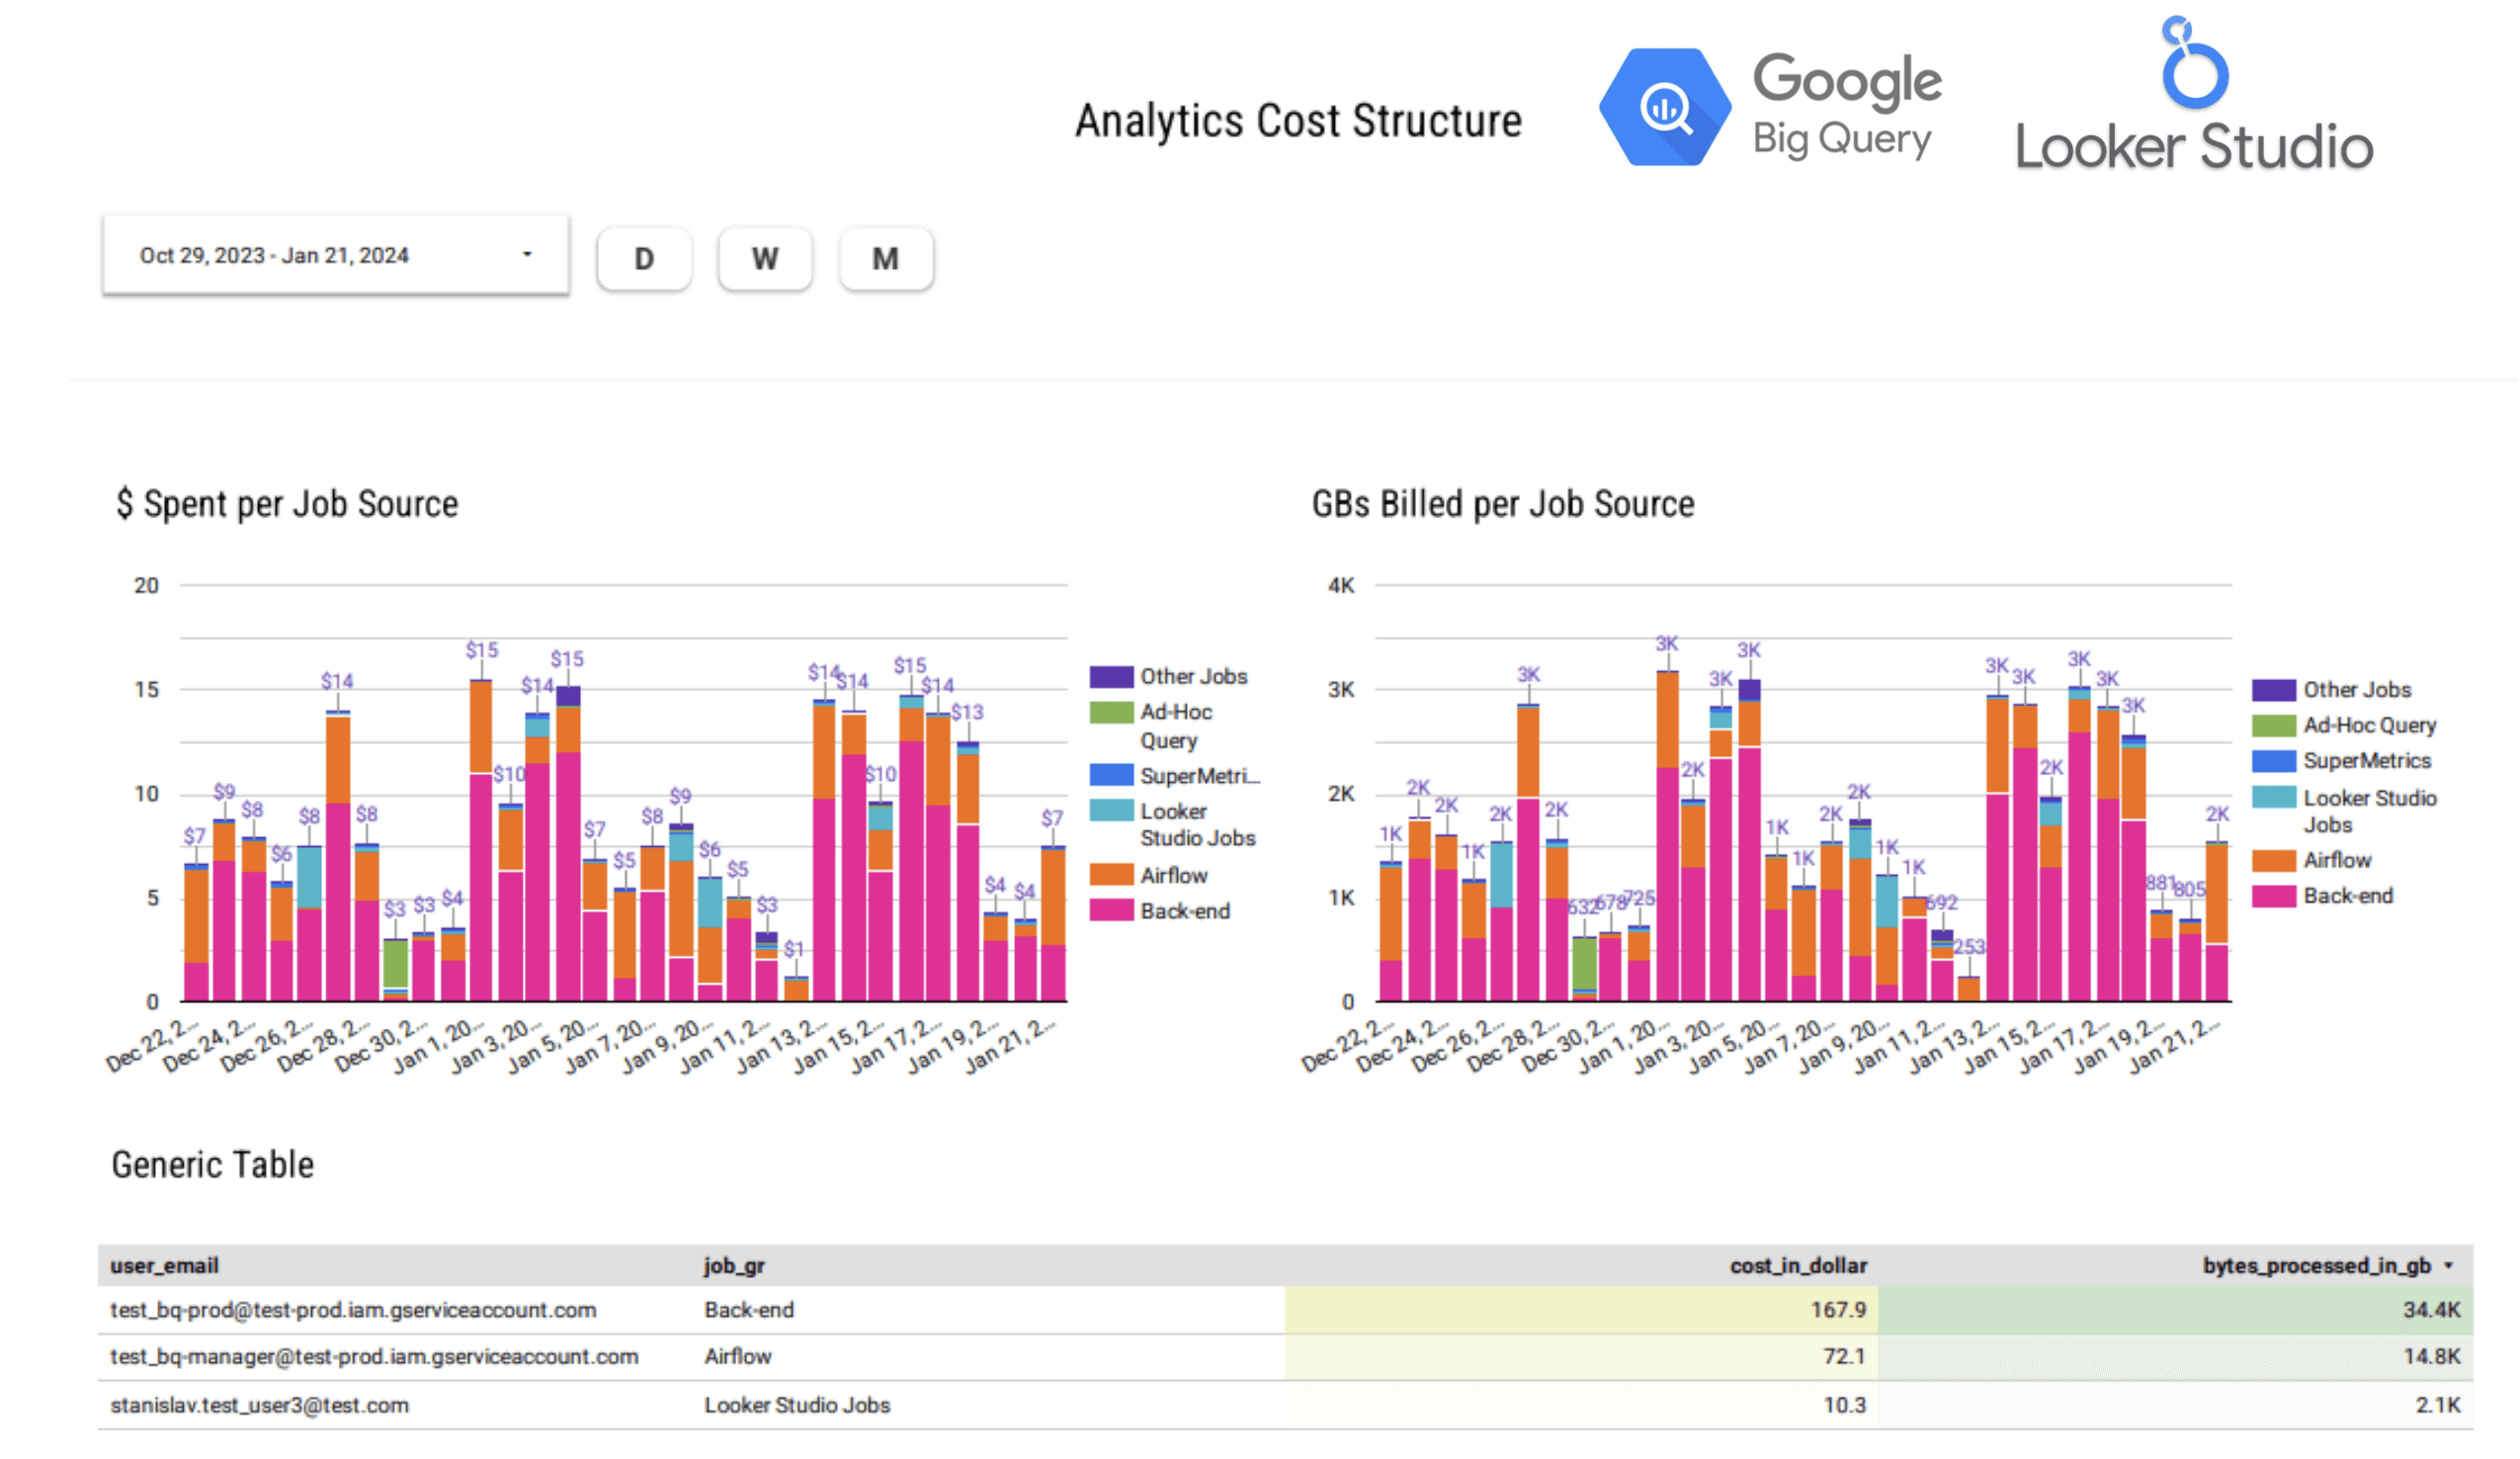
Query results give us an easy way to understand how many GB we query, total costs, distribution by user email, and project.
However, for us, it is not enough data.
Many different sense queries can be run from the same user, thus it is not that precise.
How to find out how much Looker Studio Queries cost?
In the query above, you may see the source_key and source_value cols.
They are essentially labels that BigQuery assigns to different types of jobs (Afaik BQ can distinguish only jobs that are created by Google Cloud ecosystem products like Sheets or Looker Studio).

Thus, we can use a simple "case when" to distribute jobs by their real source according to the Label value and then visualize to have a perfect clue about the cost of Analytics.
Navigating the Challenges of Jobs Without Labels
However, there are still lots of jobs that have empty Labels. There is a workaround actually -> use the job_id.
For example, in my case, the AirFlow instance creates jobs with job_id "airflow_XXXXXXXX."

Queries that were created in the BQ SQL Editor have bquxjob at the beginning of job_id "bquxjob_XXXXXX."
Hence, by combining the Label Values and Job_id we can distinguish the different sources of SQL queries.
Adapting to the 180-Day Information Retention Policy
BigQuery's INFORMATION_SCHEMA.JOBS has a data retention limit of 180 days.
Thus, if you want a sustained analytics operations, then constantly save the data.
Frequently Asked Questions
What are the signs that I need to optimize my analytics queries for cost?
Totally depends on the case, on average we pay ~$17/day for 3-4000 daily jobs. That covers all dashboards, tables, ETLs and so on.Can I set up alerts for unexpected spikes in BigQuery costs?
A lot of options here. The simplest: create a simple alert for the queries cost chart in Looker Studio (Pro version - $5/user).What strategies can I use to reduce the data processed by my queries?
We pay for scanned bytes. Partitioning is a must-have to significantly reduce the scanned volume. Sometime the difference in cost may be in 10x.
