Data Analyst Roadmap 2024 + 16 Practice Projects
Apr 8, 2024
Welcome!
What will you get from this article?
You will gain an in-depth understanding of the required analytics skills to become a DA
Data analyst roadmap for Juniors (with explanations of each skill and why it is essential or not)
Ideas of Pet Projects to prove your knowledge to the hiring and interviewing teams
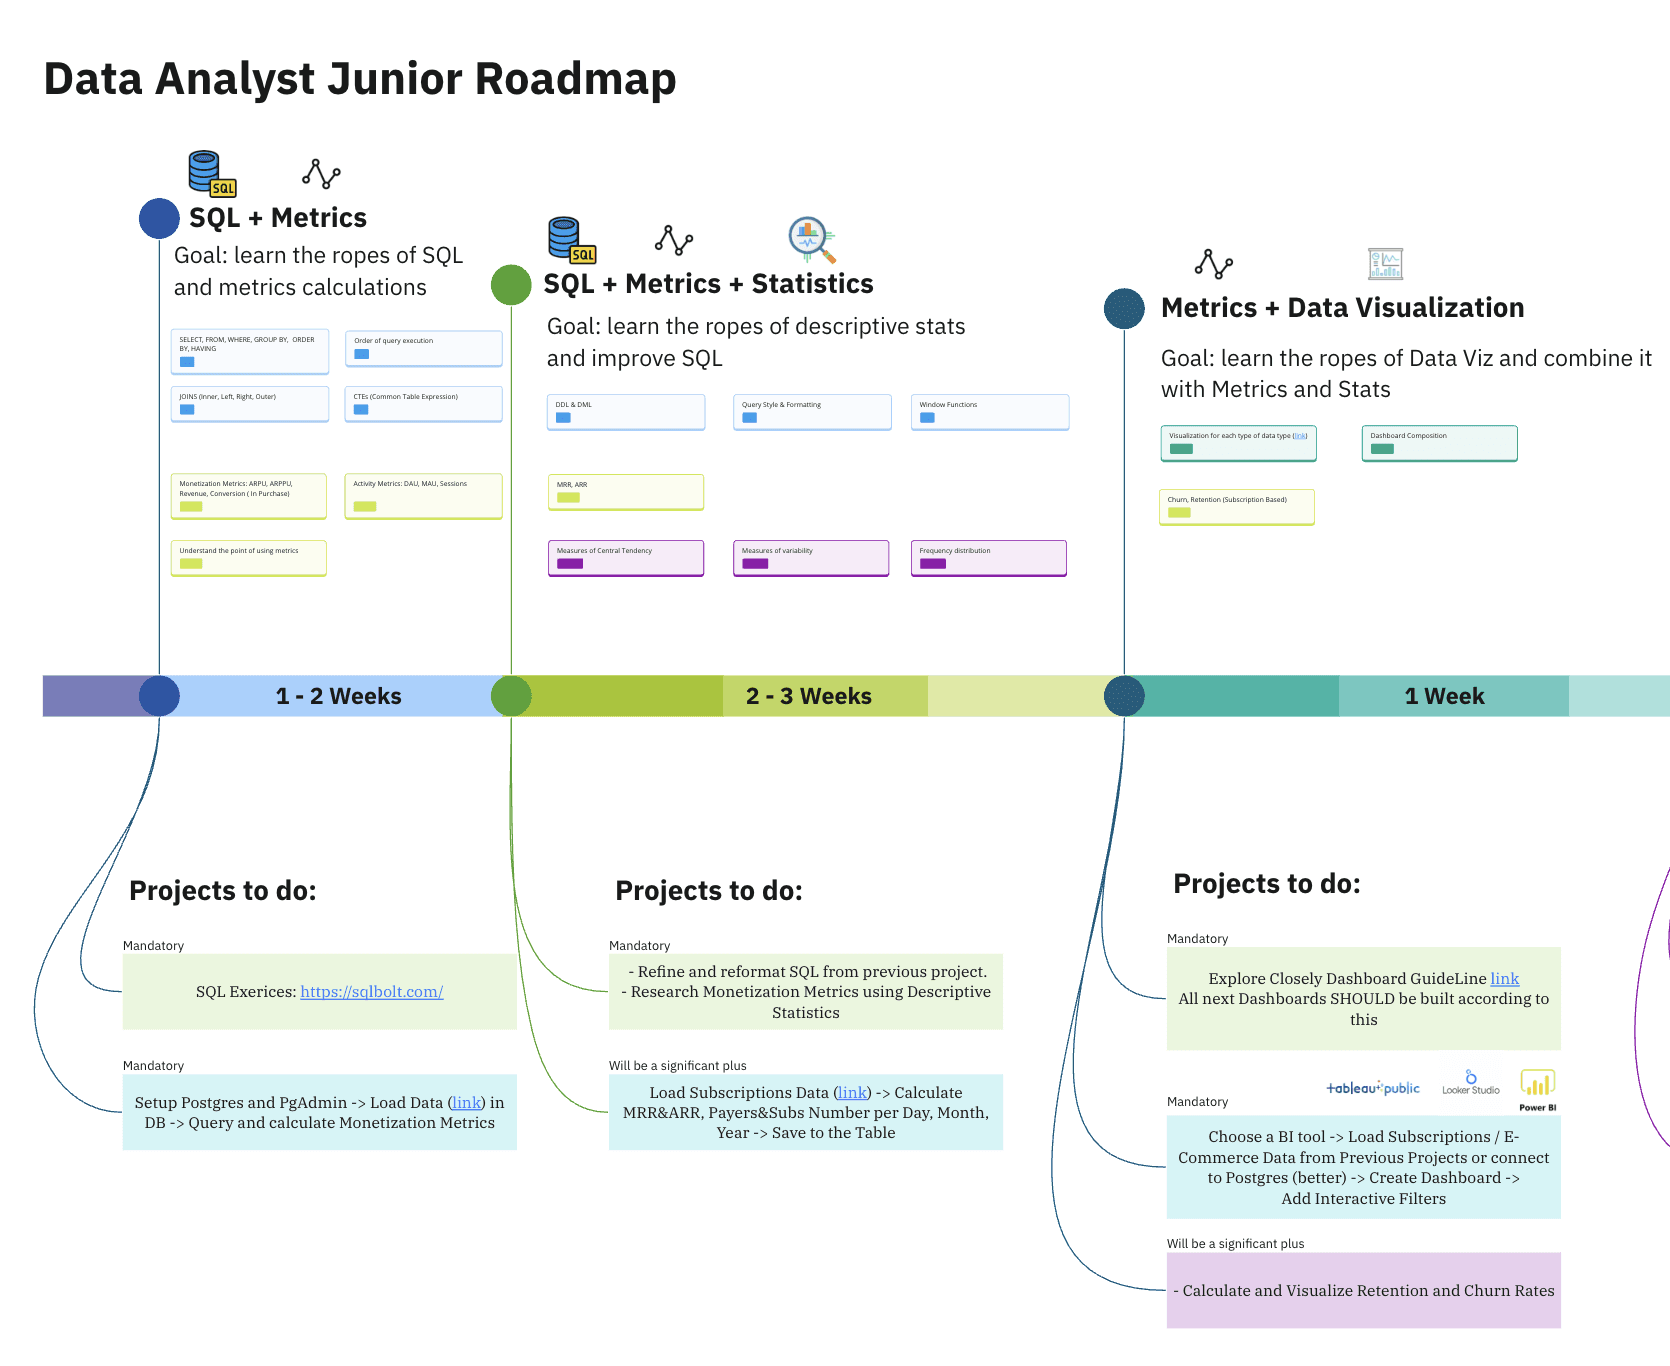
+ Miro Document with the Roadmap to copy and edit for yourself
Why listen to me?
I’ve more than 4 years of experience working in analytics. It includes not only the Analytics field but also Data and BI engineering.
This gives me the possibility to talk about the whole process of analytics flow. Also, I have a lot of mentorship experience, especially for analytics trainees and beginners.
Grab Roadmap right away - Miro Link.
1. Roadmap for Data Analyst
There is no doubt that being a beginner seeking a job is a tough one. Thus, my task is to make your journey a little bit easier and time/cost optimized.
Looking at the job descriptions or list of requirements could make you feel anxious and desperate same as I was 5 years ago:)
Yet, you do not need to know everything.
One of the most important things that no one says is that you do not need to spend 3-6 months to become a Data Analyst and then start doing your projects.
Think of yourself as of MVP.
On each step of your journey, you have to be capable of delivering the usual daily tasks as a Data Analyst. Simply with each next one, you become more skilled and capable of more complex tasks.
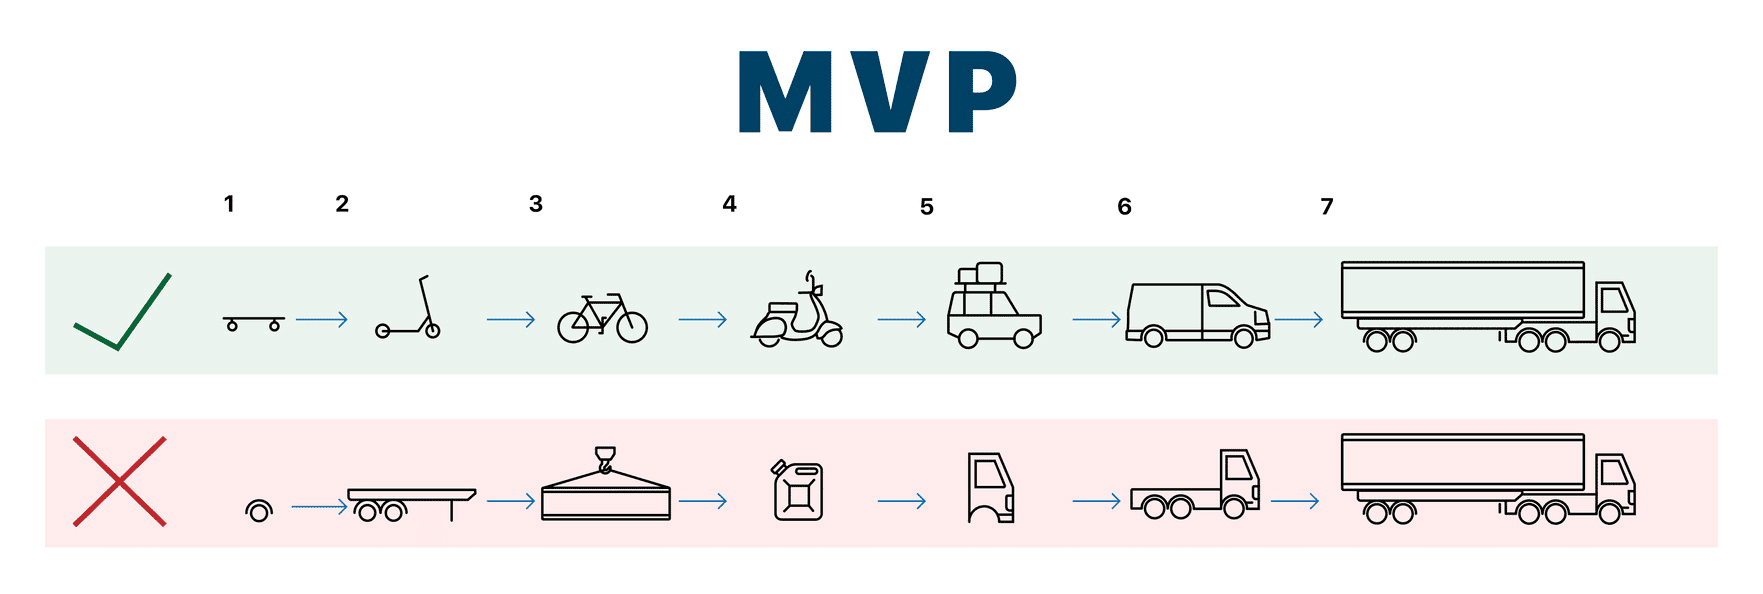
This directly changes the way of studying. Instead of studying each tool separately and then trying to connect all this huge chunk of knowledge ( and surely forgetting a lot as time goes on), there is a more optimal way.
We will grab a little basic part from a few skills, combine them and try to solve a usual daily tasks of a Data Analyst.
What do I mean?
It’s cool to practice SQL “join”, “group by”, and others, but will it be more useful if we, for example, instead of some dummy-data, take sales data and try to calculate some simple metrics?
It is not harder, but gives a direct usage of your skills.
Then, after learning the ropes of DataViz, you can simply take the data you prepared in the previous task and make a dashboard.
Step-by-step make it more complex and gain practical skills.
Why project-based education prevails for Data Analyst?
On each step of your road, you’re combining Data Analyst technical skills and proving them via accomplishing a little project.
This helps the knowledge to stay with you.
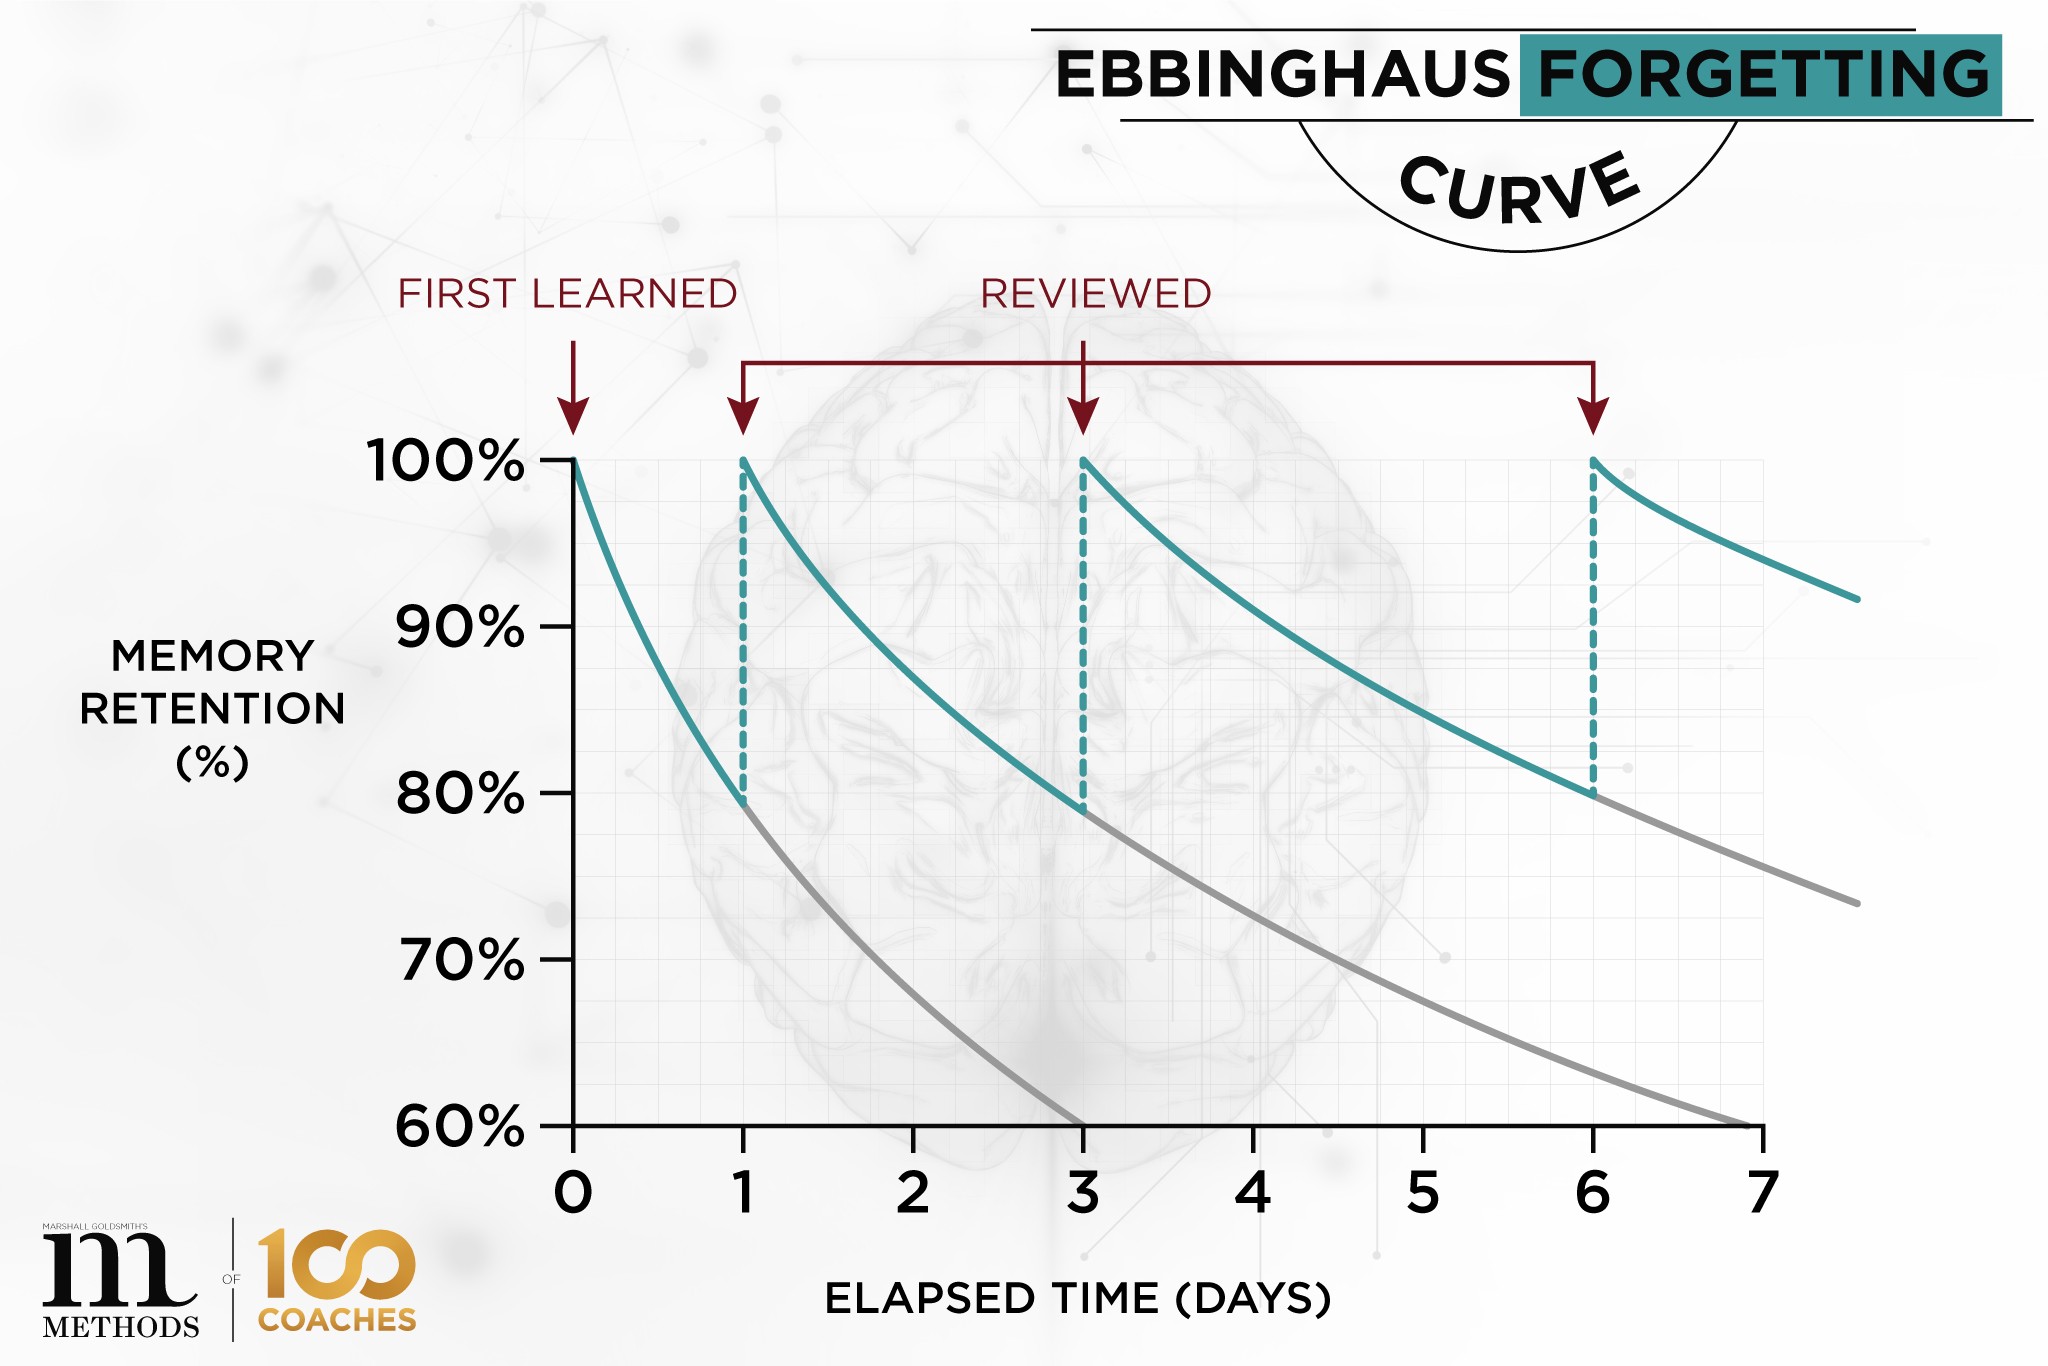
Take a look at the Ebbinghaus “Forgetting Curve”.
There is no sense for you to study one skill for a few weeks and then move to another one.
You will simply forget a lot as the knowledge without constant reviewing passes away.
2. Technical skills for Data Analyst Junior
Remember Paretto’s rule?
That’s it.
There are key analytics skills that you are going to use on a daily/weekly basis. And there are ones you are going to use once a month, quarter, or year.
It is obvious that the 1st one will land a job for a Trainee or Junior (FYI: Middle-Senior level is not like this).
For Junior Data Analysts, mastering skills is times more important than studying new ones.
“I fear not the man who has practiced 10,000 kicks once, but I fear the man who has practiced one kick 10,000 times.” -classics by Bruce Lee.
So, instead of studying 10 topics, take your time on 3-4. it will make you stand out from the overall pull of applicants. It
Focus on the most valuable skills for data analysts
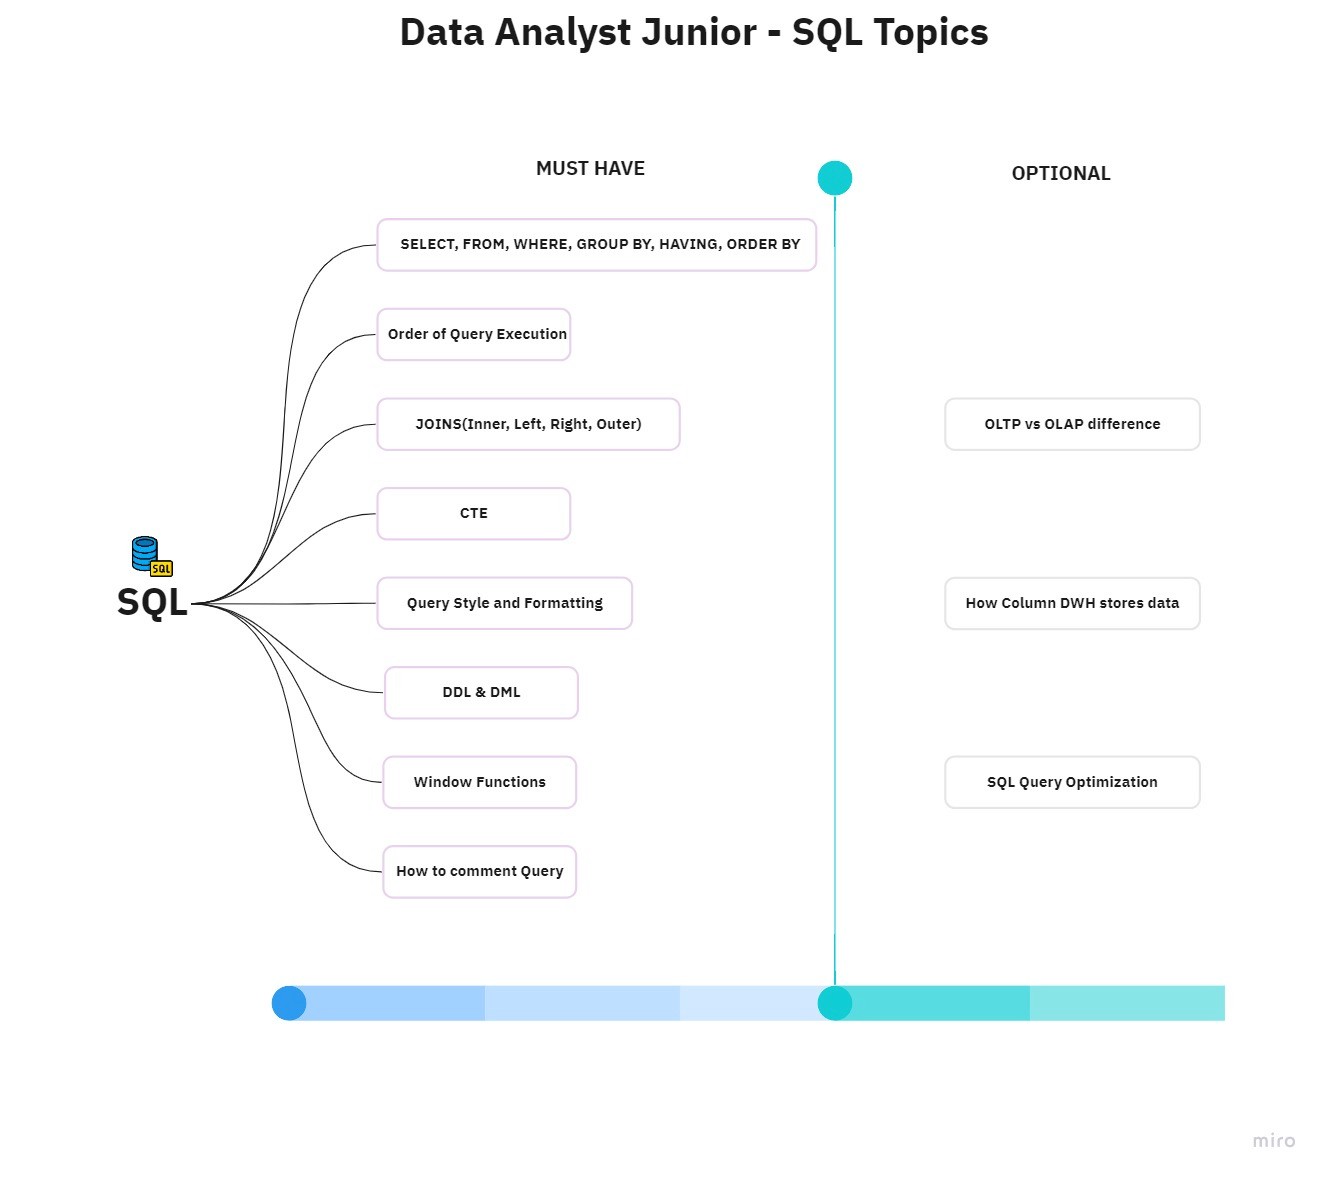
1) SQL
Why?
Everything for the Data Analyst relies on the data and the ability to get it. Each query costs money. Be the one, who knows how not to damage business with their queries:)
You are going to write queries on a daily basis, thus it is crucial to not only understand basic syntax, but also to have a clue about the way query actually works.
Must-Have Topics:
Select, Where, Group by, Having
Order of query execution
DDL&DML
Understand what means DDL and DML abbreviations in SQL :)
Query Style and Formatting
CTEs
Joins (inner, left, right, outer)
How to comment your query
Window Functions
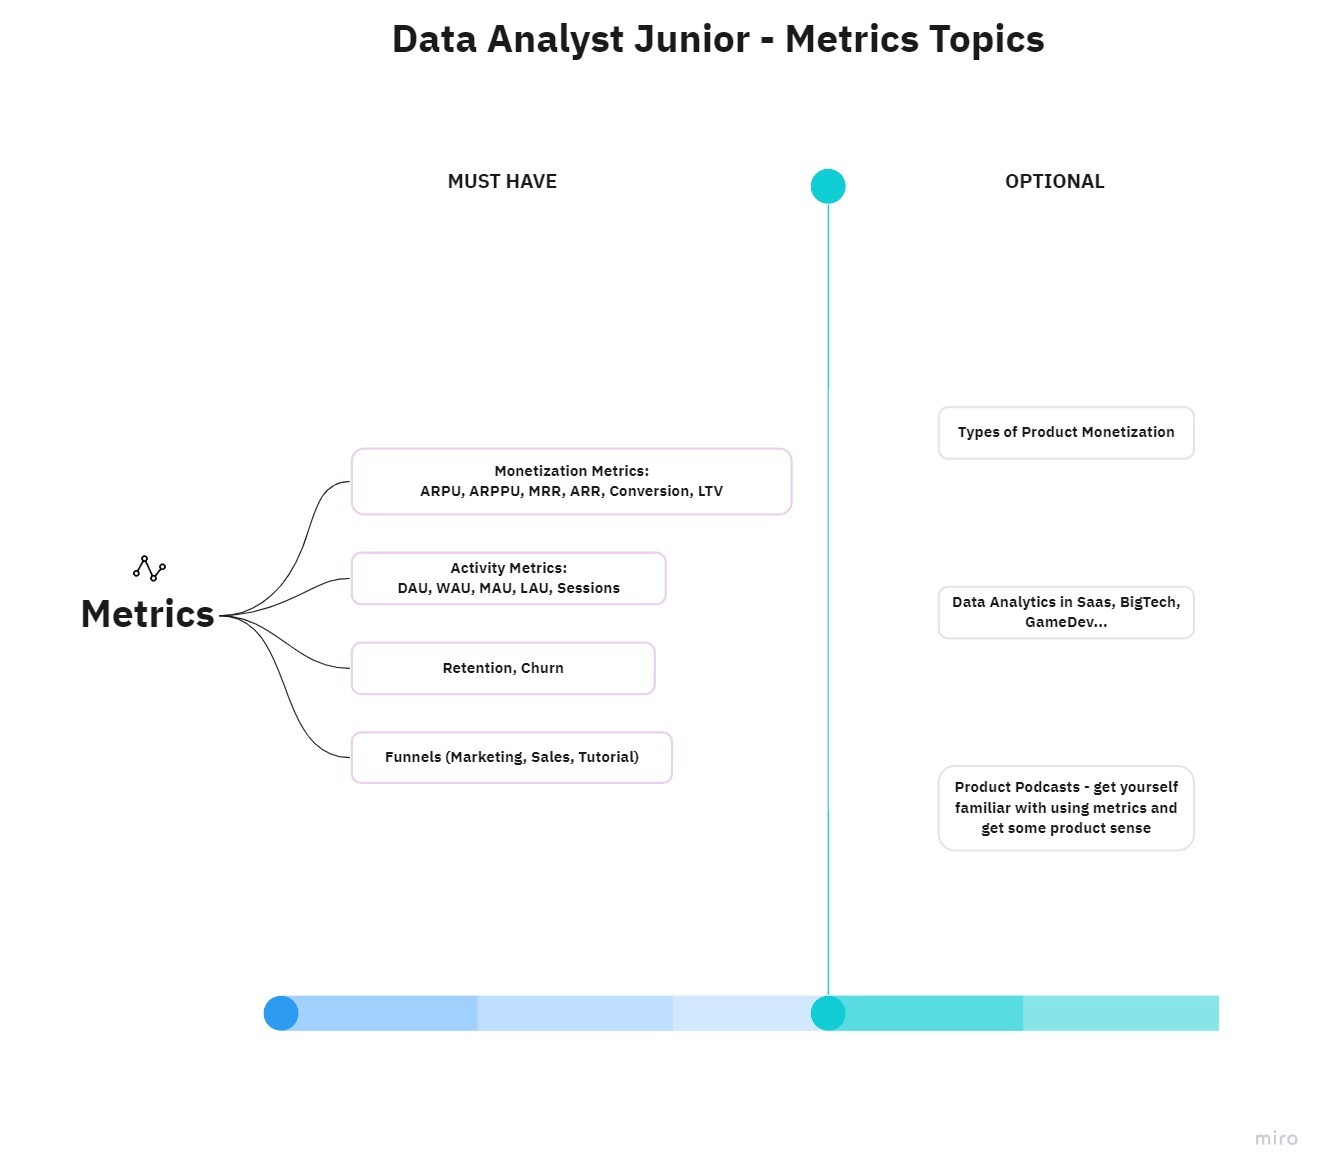
2) Product Metrics and Product Sense
Why?
To be the one who knows the most and serves as an advisor not the reporting middleman between people and data storage.
In terms of metrics, you definitely need to know how to calculate them and have a clue about their sense.
Must-Have Topics:
Activity Metrics: DAU, WAU, MAU, LAU, Sessions
Monetization Metrics: ARPU, ARPPU, MRR, ARR, Conversion, LTV
Retention, Churn
Funnels (Marketing, Sales, Tutorial)
Prove your knowledge:
Nothing tech here. Find some Product podcasts and anything related to products.
Try to understand what people say: https://producthq.org/agile/product-management/product-management-podcast/
3) Data Visualization
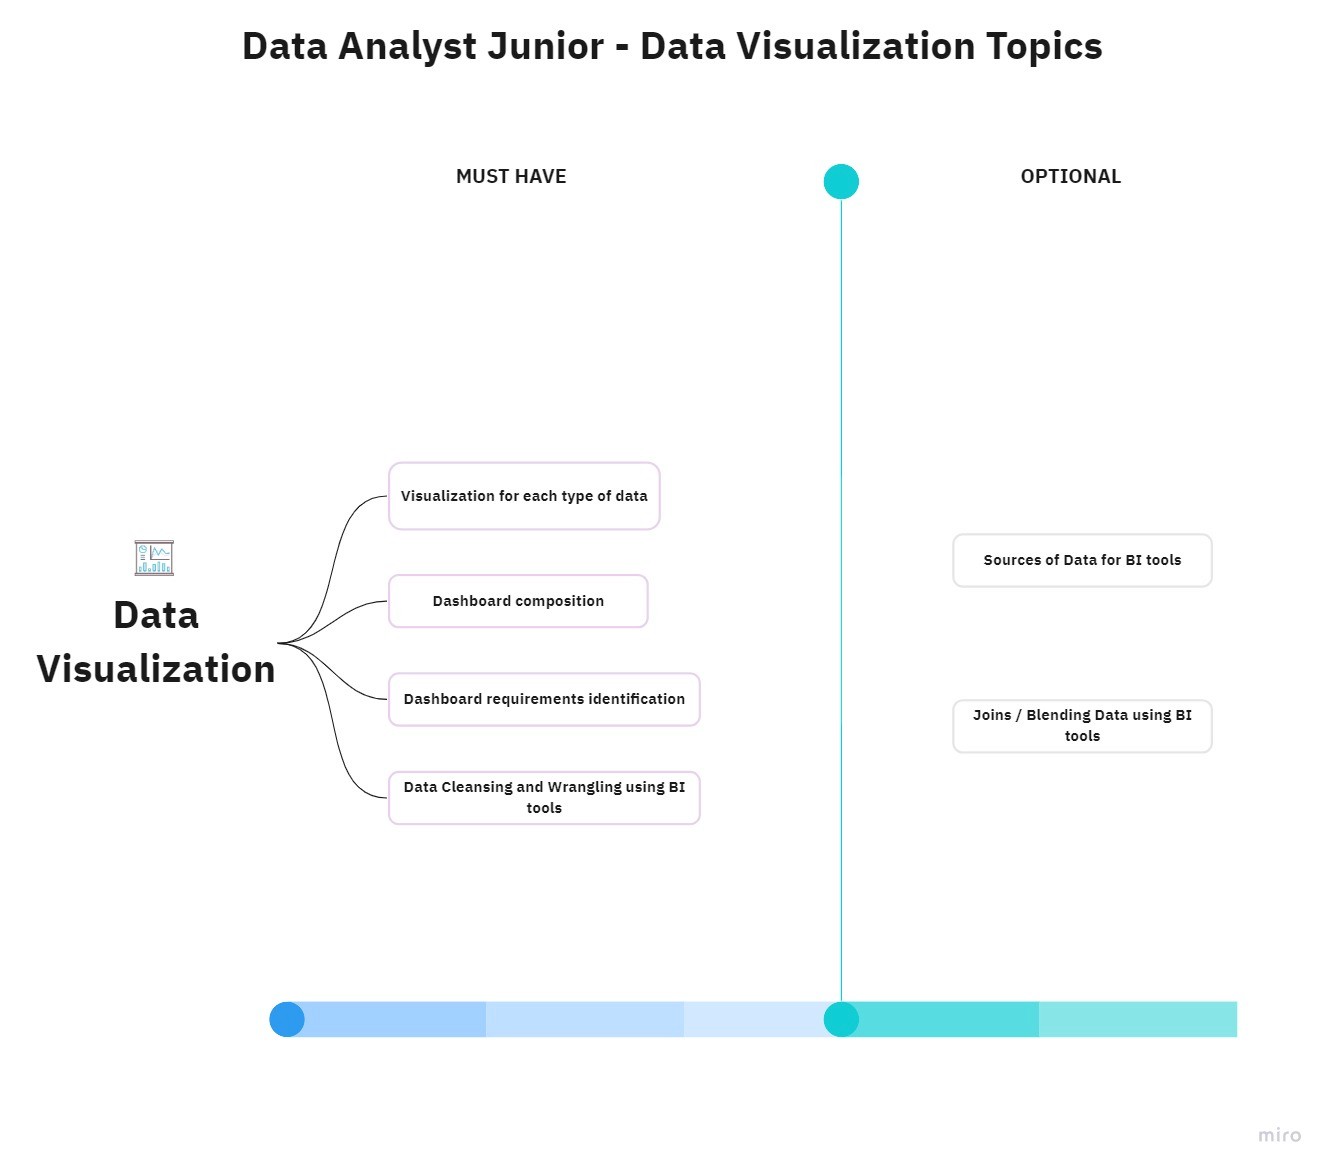
Why?
You may find such a cool insight that have a possibility to boost significantly certain metric, but what's the point if no one will understand you and your discovery?
Most probably you will pitch not to other analysts, but to the people that make decisions and ...drumroll... they know not so much about analytics, statistics and other stuff. Those people appreciate clear business usefulness and easy-to-read data.
Data visualization is your main weapon to pitch and persuade stakeholders.
Must-Have Topics:
Visualisation for each type of data (link)
Dashboard composition
Dashboard requirements identification
Data Cleansing and Wrangling using BI tools
Dashboards should be easy-to-read and ordered.
Yeah-yeah, sounds too broad and abstract.
However, it is one of the DA main duties, thus please take your time studying this, it will make your life much easier - Exness Visualization Guide.
There is no so much such recources available for free, so take it serious.
There is a lot of stuff that may sound obvious to you, but, believe me, o not, a lot of people omit these simple rules and then we got a "cemetery of dashboards".
I suppose you don't want to discover that no one uses the reports you built, isn't it?
4) Statistics
Why?
We are in the 21st century. We do not rely on personal opinions, stars, and anything except data and statistics. Statistics allows you to understand data, make decisions and prove that you are right or wrong.
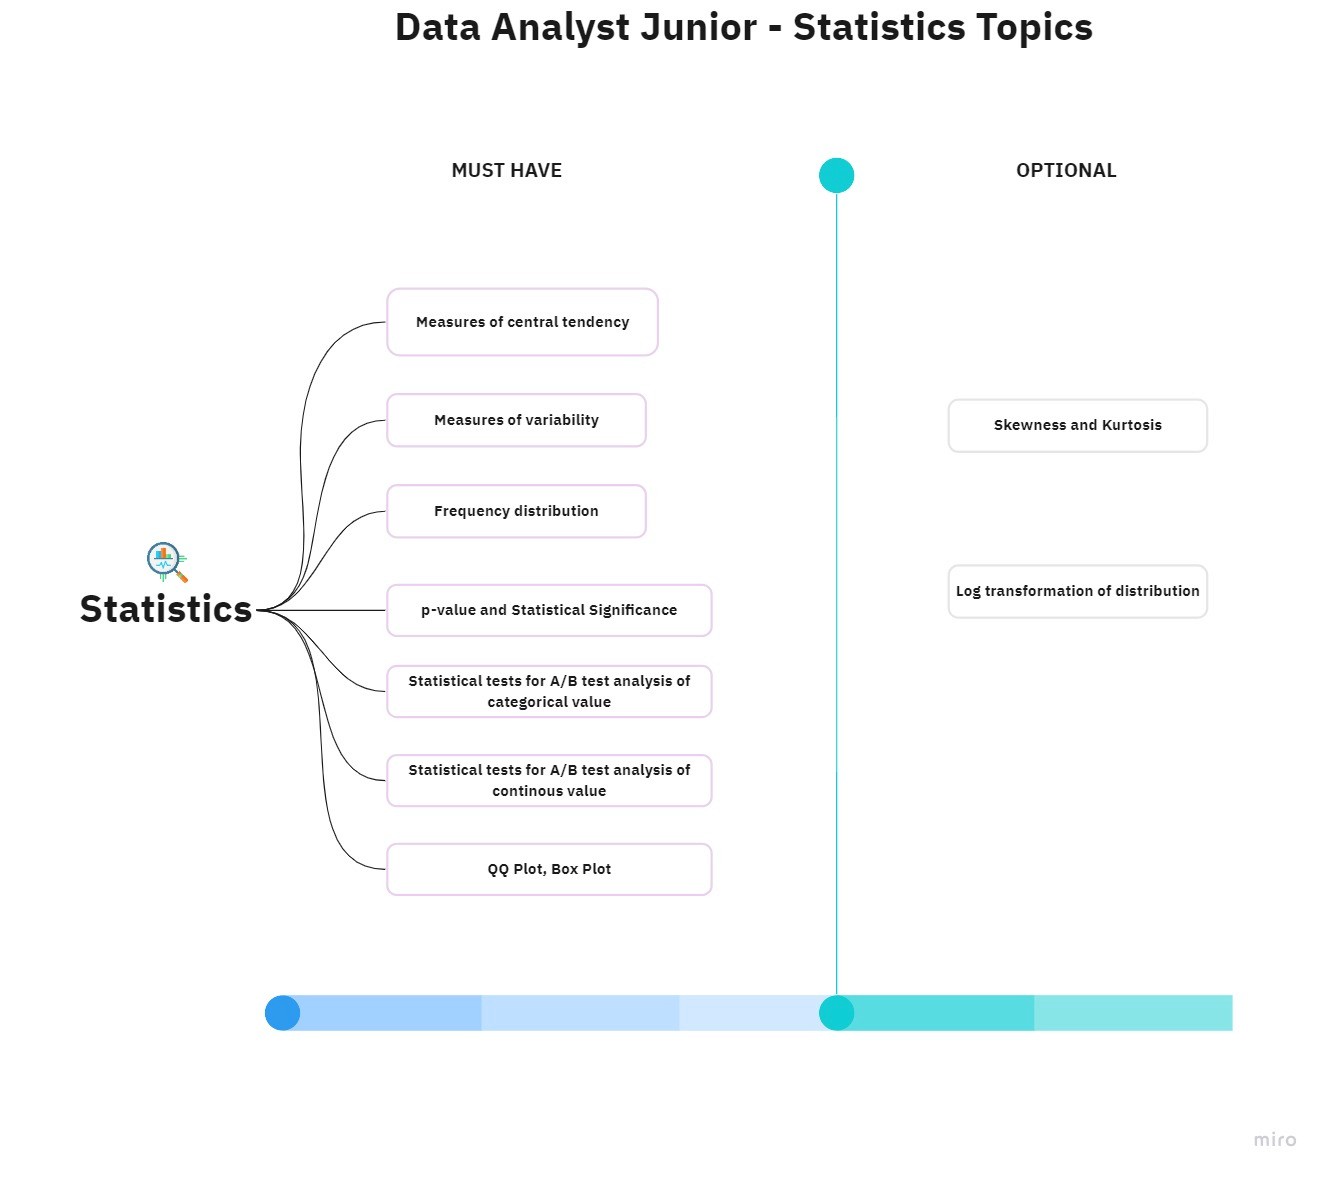
Must-Have Topics:
Descriptive stats (measures of central tendency, measures of variability, and frequency distribution)
p-value and Statistical Significance
Statistical tests for A/B test analysis of categorical value
Statistical Critereas for A/B test analysis of continuous value
QQ Plot, Box Plot
5) Python for Data Analysis
Why?
Can help automate lots of mundane tasks and, thus, save you time to generate insights or cut some costs.
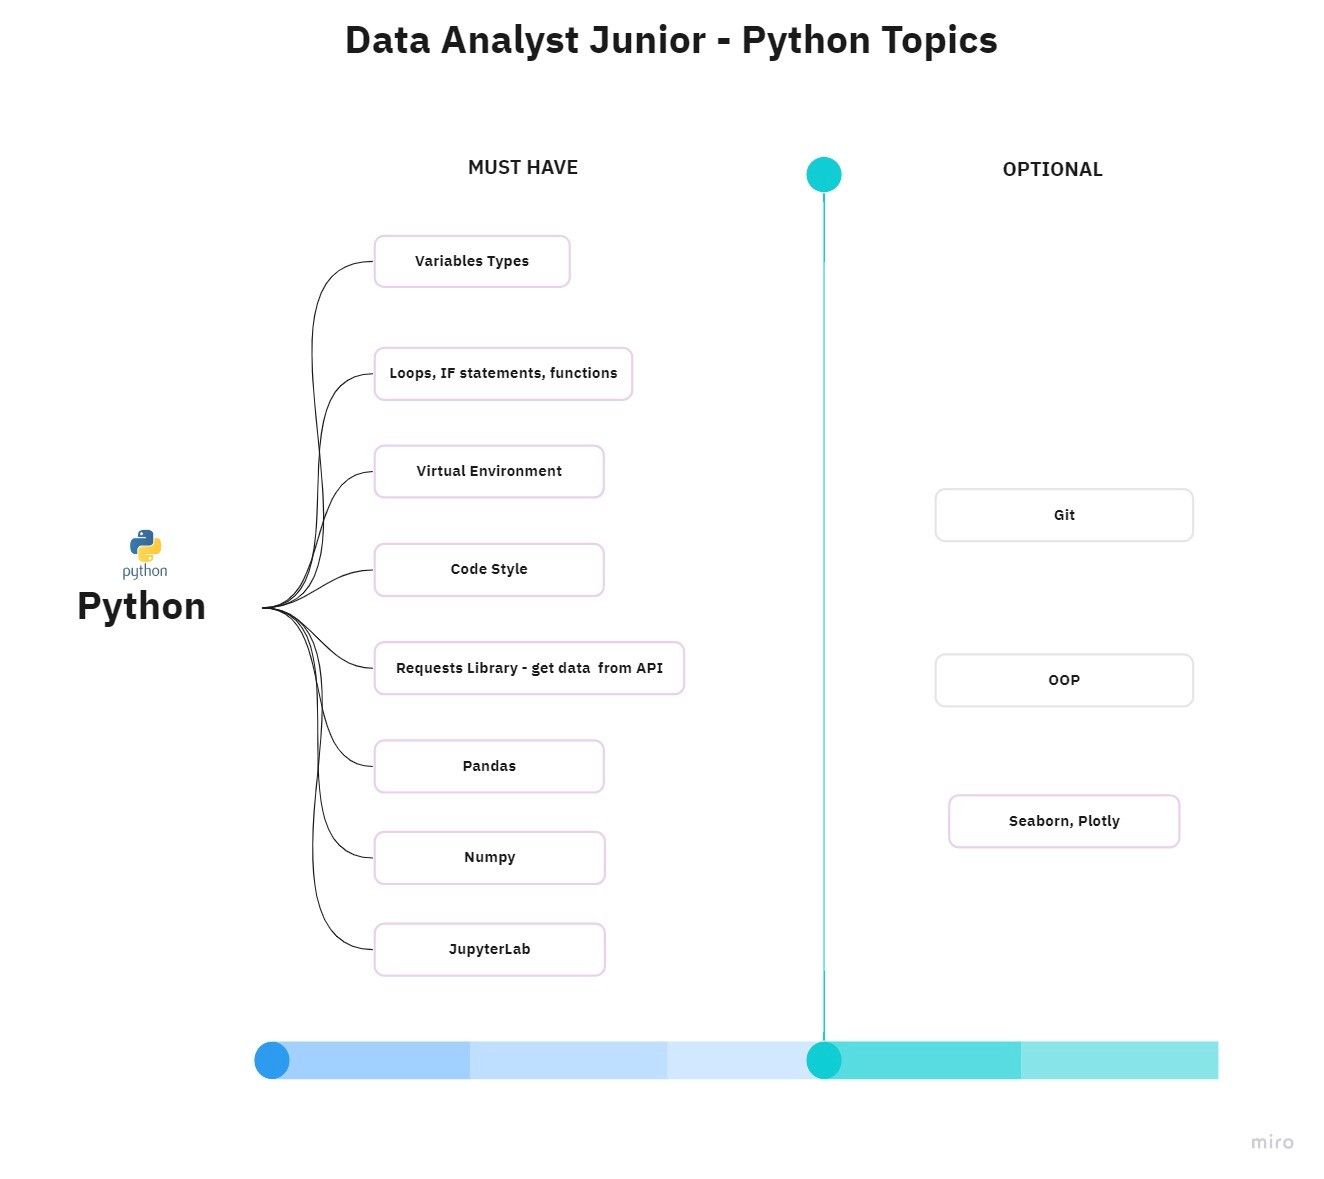
Must-Have Topics:
Variables Types
Loops, IF statements, functions
Requests Library
How to communicate with external API
Virtual Environment
Code Style
Pandas
Numpy
Jupyter
Conclusion
Drink water, save articles into bookmarks, and never drop tables in the production DB!
Cheers,
Stan.
